

The Directional Policy Matrix (DPM) is a business tool that can be used to highlight products, services or segments which are attractive to a company (market attractiveness), where the company has a strong competitive position, and also the market size. The purpose of the model is hence to direct strategy based on the attractiveness of a market and the capability of the organization to fulfil the opportunity. It is most useful when an organization has several countries, products, or segments to investigate.
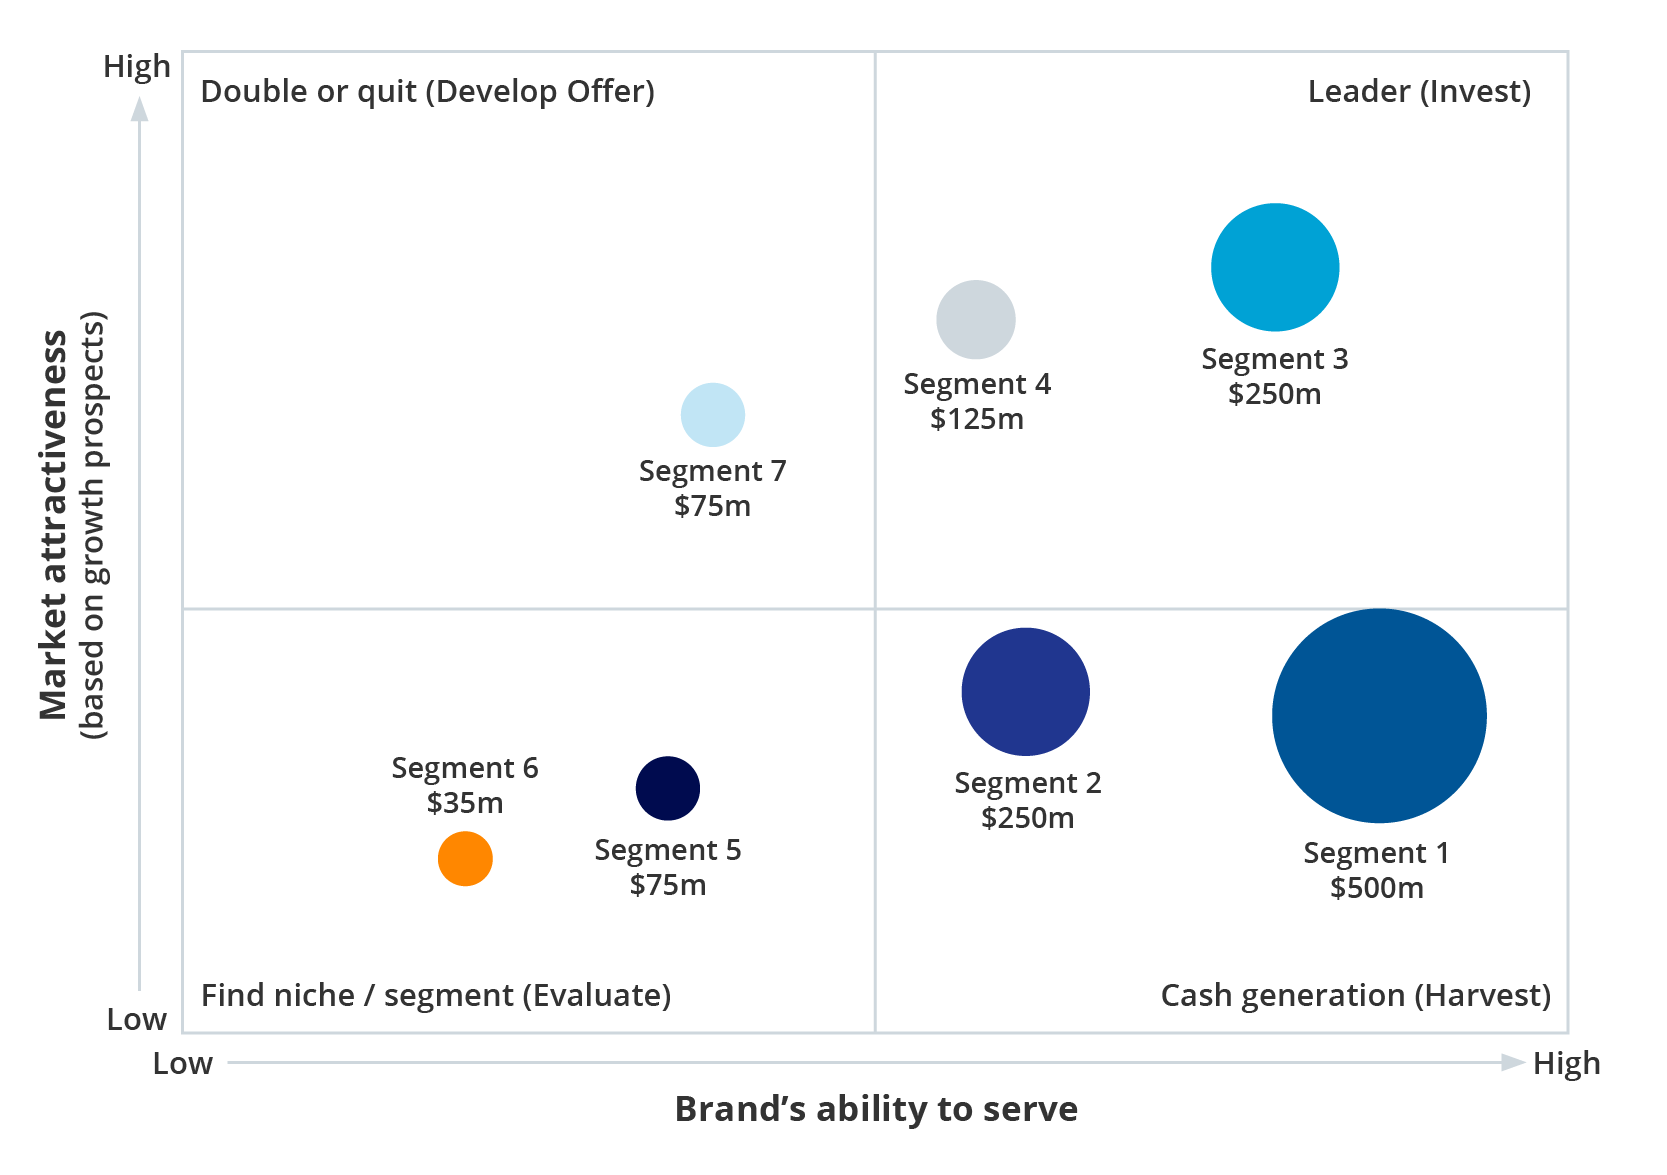
Example of a Directional Policy Matrix (DPM) chart. Bubble size indicates market size.
Market Attractiveness
We can use the DPM to assess the attractiveness of markets, products, or segments for an organization. Market attractiveness can be assessed through a variety of factors, depending on the use case of the DPM. We can use attractiveness indicators such as growth prospects, profitability or even suitability to the organization (which may be driven by factors such as previous profitability, for example). Adapting the ‘attractiveness’ indicator to the organization’s strategic priorities means that we can develop a DPM that gives the organization the most relevant measure to drive action.
Ability To Serve the Market
When using the DPM, it is important to understand the capability of the organization to serve each segment, country, or product. The competitive position is usually calculated based on the accessibility of the market or on competitive advantage relative to competitors.
Accessibility Of the Market
The accessibility of the market may be determined based on factors such as existing routes to market, infrastructure, or knowledge of the market. Each of these factors could mean that the considered market is more accessible, and hence may provide ‘low hanging fruit’ for the organization to take advantage of.
Competitive Advantage
We would want to consider how well competitors perform in the market in order to assess the best strategic direction or opportunity for an organization. If there are several very strong existing competitors in a market, it may make the opportunity less attractive for the organization, as it may be more difficult to establish in a saturated market.

Market Size
We can include the market size as a measure in the DPM. This gives the organization a steer on which segments, products or countries provide the biggest market opportunity. Market size can be based on a few different variables, such as the financial value of the market or number of products sold, for example.
Driving Strategy
Based on the findings of the DPM, we can place markets, segments, or products into four different categories, in order to drive strategy and action:
-
Areas to invest / ‘go all in’: Markets, segments or product categories which are highly attractive and a very strong fit with the organization.
-
Cash generation / ‘cash cow’: Markets, segments or product categories which are a very strong fit with the organization, but which may be less attractive (e.g., in terms of market size). These, however, provide a good opportunity for cash generation for the organization.
-
‘Double or quits’: Markets, segments, or product categories where the organization’s current ability to serve is low, but market attractiveness is very high. These markets, segments or product categories will require a lot of investment for the organization to serve but could provide a big opportunity.
-
Evaluate / disinvest: Markets, segments or product categories which are a low fit for the organization and are also low in attractiveness.
Categorizing markets, segments, or product categories into these four segments can indicate the best way for organizations to move forward with their strategy, highlighting key opportunities, but also where they may need to withdraw or disinvest.
Can I Use The DPM In Qualitative Research?
Whilst the traditional DPM is very much suited to quantitative research, its principles can also be translated for qualitative research. It is especially useful to highlight company strengths and weaknesses, whilst also looking at market attractiveness. We may look at comments relating to future opportunities to establish market attractiveness. Plotting these factors on the same chart allows us to draw clear conclusions on where the opportunity lies for the organization, and which products or services are less attractive. This can help to direct strategy and focus for organizations, even without conducting quantitative research.
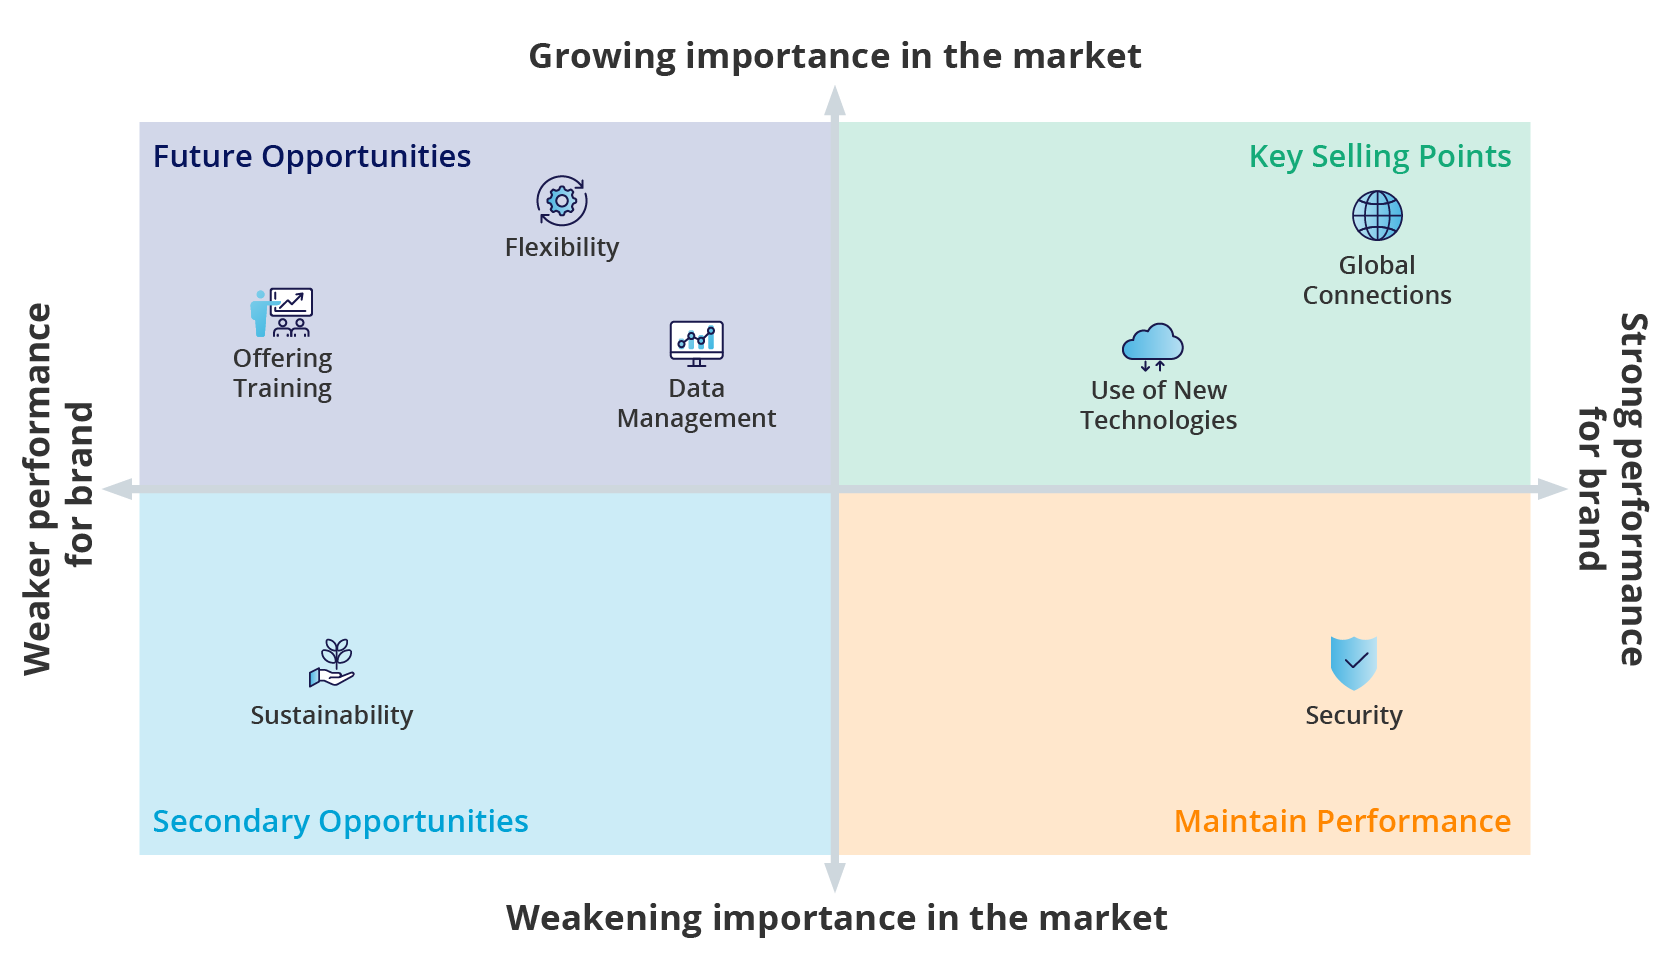
Example of a qualitative adaptation of the Directional Policy Matrix.
Readers of this article also viewed:
What to Consider When Evaluating Market Opportunities How Market Research Can Help Guide Your Market Entry Strategy Using the Push-Pull Model to Successfully Bring New Products to Market Competitive Landscape Analysis with Porter’s Five Forces Framework PESTLE Analysis: Understanding Market Influences for Better Decision-Making
To discuss how our tailored insights programs can help solve your specific business challenges, get in touch and one of the team will be happy to help.