The Gabor Granger pricing model was developed in the 1960s by two economists, Andre Gabor and Clive Granger. It was developed as a method for determining the price elasticity of products and services. The tool is simple and is based upon asking people the likelihood of their purchasing a product or service at different prices. In spite of its apparent simplicity, the Gabor Granger method is a tried-and-tested tool that continues to be used in many product development research projects.
How does the Gabor Granger method work?
Using Gabor Granger is simple and is based upon asking people the likelihood of their purchasing a product or service at different prices. This enables us to plot a demand and revenue curve so that we can determine the optimum price to deliver the maximum revenue.
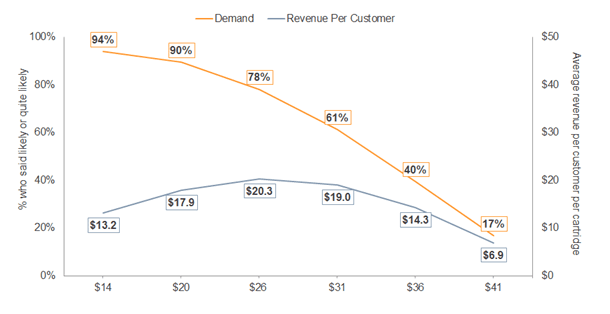
An example of the results from a Gabor Granger question is shown below.
In the example, we can see that if the product is priced at $41, only 17% of people would buy it. We can also calculate the revenue per head for everyone in the sample. At a price of $41 this works out at $6.90 per respondent. However, at a product price of $26, over three quarters of people say they would buy the product and this would generate the maximum revenue per head of $20.30.

How does the Gabor Granger pricing model help to calculate price elasticity?
The advantage of the Gabor Granger pricing model is its simplicity. Both respondents and clients can quickly and intuitively understand the question and there are no misunderstandings. It can also be applied to a small sample though generally we would recommend a minimum of 50 respondents.
The data can be used to calculate the elasticity of demand. The elasticity of demand is an important metric in pricing research as it tells us the implications of lowering or raising prices.
A product with a high elasticity of demand (i.e. greater than 1.0) means that if the price is lowered by a certain percentage, the percentage volume that will be generated will be greater than the percentage price increase. Equally, if the elasticity of demand is less than 1.0 it indicates that if the price were to increase by a particular percent, the percentage volume drop in sales would be lower.
Using data from the above graph we can see that the elasticity of demand for the product in question is:

To calculate the elasticity of demand, we look at the curve between an acceptable maximum price ($31) and an acceptable minimum price ($20), from the overall demand curve.

This indicates that the product is relatively inelastic in so far that increasing or lowering the price will not generate a disproportionately higher volume of sales. The implication is that with this product the company would be better off raising its prices because this would increase margins and there would be a minimal loss of business.
Case study: Using the Gabor Granger technique to set the optimal price
Business challenge
Our client wanted to introduce a new health and safety product and was unsure what price to charge.
What we did
When looking at all the information available and the requirements from the client, we decided that the Gabor Granger pricing model would be most suitable.
Using the Gabor Granger method we were able to show that a specific price would generate the maximum amount of revenue. This price was somewhat higher than would have been assumed by our client using judgement alone. By using Gabor Granger to show how to optimize pricing for revenue generation, the product was profitable very soon after launch.


