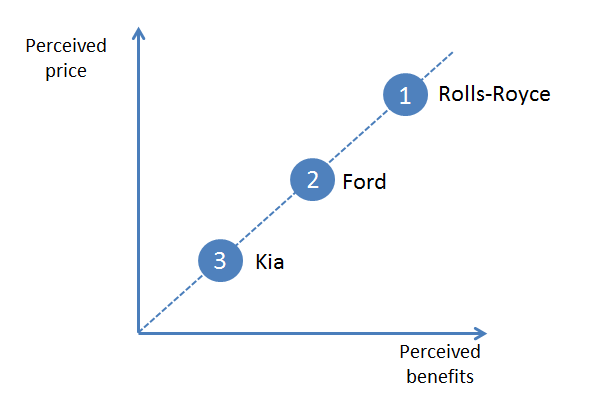
A man goes into a dealership to buy a Rolls-Royce. He perceives there to be many benefits associated with the car and these he believes are justified by its high price. Another man goes into a dealership to buy a Ford car. He too has a perception of the value of that car and in his mind it is priced appropriately. Yet another man goes into a dealership, this time to buy a Kia car. He perceives the price and the benefits to be just right for him – indeed it is why he has chosen that particular brand. These individuals perceive their cars of choice to give them benefits appropriate to the prices even though they are quite different. If we were to plot the brands on the perceived prices and benefits, they would sit comfortably on a line that bisects both – we call this the value equivalence line (VEL).

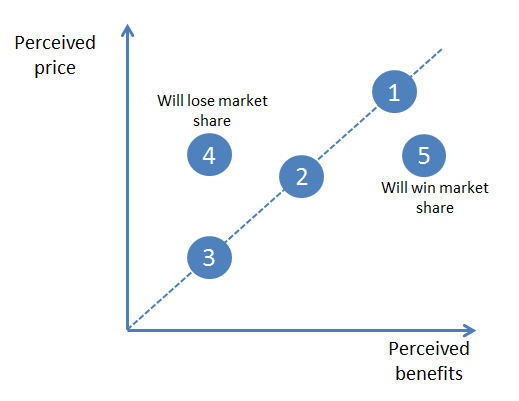
If a brand holds a position away from the line, say it is perceived to have a high price relative to the perceived benefits (brand number 4), people will shun the product and it can be expected to lose market share. On the other hand, if a brand has a price against which the benefits are thought to be considerable (brand number 5), it will sit to the right-hand side of the VEL and attract more customers. It will win market share.

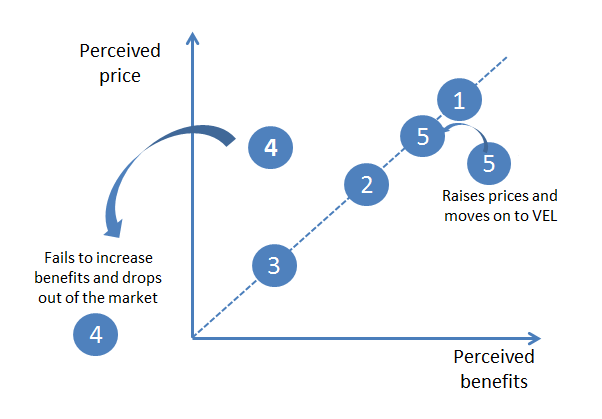
Over time the brand which is offering poor value (brand 4) will either drop out of the market or will have to make an adjustment by lowering its price or improving its perceived benefits. The brand which is offering a high perception of value for money because of its relatively low price compared to its perceived benefits will gain market share to the point where it begins to define the market. The value equivalence line will pass through this brand as it has reached a dominant position and is setting the standard for other brands. Equally, the owner of the brand could take the strategic decision to raise prices so that it falls back towards the value equivalence line (brand 5).

It should be emphasized that we are measuring perceptions of both price and benefits and these could be wrong. In the above example, company 4 is thought to offer relatively few benefits for the perceived price. It is just possible that the promotions supporting company 4 haven’t communicated the true benefits of the company and it is being maligned. If this is the case then a promotional campaign, correcting the perceptions, may well be the way forward. So too, a brand could be perceived to have a high price when in fact it offers very good value for money because it lasts longer than other products on the market. Again, this could be something that requires addressing through a communications campaign.
Understanding the position of brands on the VEL is important as it leads to strategic decisions on both pricing and product development.
Two simple questions can be asked to determine a company’s position on the VEL. These are:
How would you rate Company A on the benefits you get from buying its products and services compared to the benefits you get from other suppliers?
| Significantly better | |
| Somewhat better | |
| Neither better nor worse | |
| Somewhat worse | |
| Significantly worse |
How would you rate Company A on the prices of its products and services compared to the prices of other suppliers?
| Significantly better | |
| Somewhat better | |
| Neither better nor worse | |
| Somewhat worse | |
| Significantly worse |
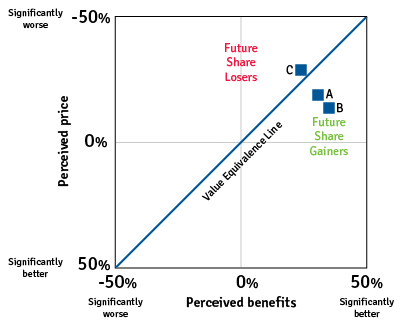
The same questions can be asked of other companies in the market (e.g. companies B and C). The answers to these questions can be plotted on an XY graph to show the position of the brands and from these, a brand owner can formulate a pricing and product strategy.


