If you are reading this White Paper, you most probably work for a “corporate”, that breed of company that employs hundreds of people and has revenues of millions if not billions of dollars. Big companies understand how other big companies tick and therefore almost certainly other large companies will feature strongly in their customer lists. Maybe somewhere down the line their products reach small companies but, if this is the case, it will be through distributors. In other words, the “tribe” of small companies is not well known or understood by corporates.
A Most Prolific Animal
Small companies offer a huge opportunity for big companies. There are millions of them. They react quickly to offers, pay top dollar for products and services and, when the rest of the world is wringing its hands and tightening belts, small businesses make quick adjustments and their wheels keep turning. However, in order to do business with small companies, it is necessary to understand them. This is the subject and purpose of this White Paper.
Small businesses range in size from sole proprietors – the one person band running his or her business with no employees – through to those that have up to 50 employees. The sole proprietor is by far the most prolific, accounting for around a half to three quarters of all small businesses. The table below gives examples from around the world.
| Country | Total | Employee Enterprises | Employee Enterprises Size | ||||
|---|---|---|---|---|---|---|---|
| Sole Proprietors | With Employees | % of Sole Proprietors | 1 to 9 | 10 to 19 | 20 to 50 | ||
| USA | 25,168,000 | 20,326,000 | 4,842,000 | 81% | 3,821,000 | 633,000 | 388,000 |
| Brazil | 5,658,000 | 3,190,000 | 2,468,000 | 56% | 2,083,000 | 266,000 | 120,000 |
| UK | 4,751,000 | 3,546,000 | 1,205,000 | 75% | 1,033,000 | 120,000 | 53,000 |
| Spain | 3,328,000 | 1,767,000 | 1,560,000 | 53% | 1,403,000 | 102,000 | 56,000 |
| Germany | 3,140,000 | 1,779,000 | 1,361,000 | 57% | 1,174,000 | 136,000 | 51,000 |
| France | 2,970,000 | 1,813,000 | 1,158,000 | 61% | 909,000 | 216,000 | 32,000 |
| Mexico | 2,892,000 | 1,645,000 | 1,247,000 | 57% | 1,065,000 | 146,000 | 36,000 |
| Canada | 2,290,000 | 1,234,000 | 1,056,000 | 54% | 866,000 | 143,000 | 47,000 |
| Australia | 2,258,000 | 1,338,000 | 921,000 | 59% | 846,000 | 49,000 | 25,000 |
| South Africa | 1,894,000 | 1,072,000 | 822,000 | 57% | 694,000 | 95,000 | 32,000 |
Source: National Statistical Offices of different countries
In most countries of the world, the definition of small business includes companies employing up to 50 people, after which they are classified as medium in size until they hit 250 employees, at which stage they become “corporates”.
As we think about small businesses, we should bear in mind that the sole proprietor is very different to the company that employs 50 people. Indeed, we start to see a change in the nature of small businesses once they employ just a few people. This is exemplified in a recent survey of small businesses from around the world, where business owners were asked whether or not they had a well-defined approach to growth over the next three years. Once companies start to employ people, they think differently – especially about the important subject of growth.
| Number of employees | ||||
|---|---|---|---|---|
| Sole Proprietor | 1-10 | 11-25 | 26-50 | |
| Yes | 46% | 62% | 74% | 79% |
| No | 54% | 38% | 26% | 21% |
| Total | 100% | 100% | 100% | 100% |
Source: B2B International survey of 853 small businesses in the US, UK, Australia, South Africa 2010
The Economic Activities Of Small Businesses
Within the “small business” classification there is scope for considerable variation. There are hundreds if not thousands of types of small businesses. Just taking the NAICS (the North American Industry Classification System) or the SIC codes (the UK Standard Industrial Classification), there are over 1,000 classifications of business types from suppliers of asbestos products to X-ray apparatus. However, we can collapse these myriad categories into three broad groups:
- Companies that produce, manufacture or process things
- Companies that retail, distribute or merchant things
- Companies that offer professional advice or knowledge-based services.
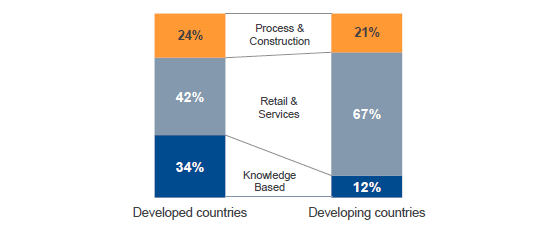
Using these broad classifications we can see that there are far more small companies in retail and associated services in developing countries (e.g. Brazil and Mexico) and relatively more knowledge-based companies in developed countries (e.g. North America and Europe).

Source: B2B International survey of 4,000 small businesses in 10 countries – 2010
Attitudes To Risk In Small Businesses
It is widely assumed that small companies are entrepreneurial. The fact that someone has taken the plunge and set up in business suggests that this is the case. However, a small company may have been established because the proprietor was forced into a situation where he or she had to retire early, was made redundant or simply could not find employment. In a recent survey of 400 Australian small businesses, only a third of respondents agreed with the statement "I am an entrepreneur".
It is therefore not surprising that most small business owners are risk averse. In the same Australian survey of small businesses, only 30% of the 400 respondents agreed with the statement “I enjoy risk taking when there is a potential high reward”. Having established their business and managed it through difficult times, they don’t want to bet the farm.
For many people, their small business is simply a job which provides an income. The average income for a small business owner in developed countries is $100,000 per year – not a huge amount for the long hours that are worked, the responsibility that has to be shouldered, and the capital that has been invested.
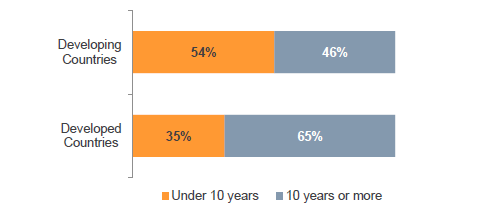
Two thirds of small companies in developed countries have been in existence for 10 years or more and have not managed to grow beyond their small status.

Source: B2B International survey of 4,000 small businesses in 10 countries – 2010
This fits with another characteristic of small businesses: the age of the owner. Typically, the owner of a small business is in their 50s or even older. In fact, when we look at the whole body of small companies, only around 5% of them have recently been established (i.e. within the last couple of years). The bank stock of small businesses is like a bathtub with new companies constantly being established while others go out of business and the water in the bath stays relatively stable.
Failure Rates Of New Businesses
There is a myth that 9 out of 10 new businesses fail in the first year. Various studies have been carried out on this subject and the failure rate is very much dependent on the type of business and its funding at the time it is established. In the UK, for example, one in three start-up businesses fail in their first three years. Equally, two thirds survive.
Young entrepreneurs and firms with no starting capital have high closure rates. Manufacturing companies have lower closure rates than service and retail trade firms. Not only do a large percentage of new businesses remain open for a good period of time, but of the ones that do close, about a third are successful at that point of time. The owner may be offered more lucrative employment or find that the business didn’t live up to expectations.
Cash Flow And Small Businesses
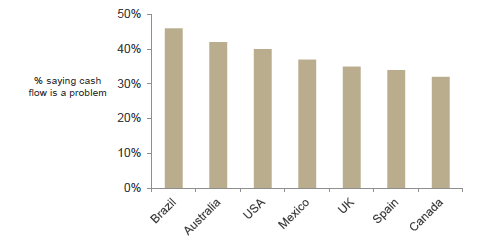
A problem faced by many small businesses is cash flow. There is a temptation for small businesses to try to grow too quickly, and end up borrowing too much money with crippling repayment charges. A survey of small companies across different countries suggests that for 30 to 40% of them, cash flow is a problem.

Source: B2B International survey of 2,900 small businesses in 7 countries – 2010
Segmenting Small Businesses In Different Ways
It goes without saying that there are many ways that small businesses can be classified. The hairdresser is clearly very different to a company producing metal parts and in turn is different to an advertising agency. Sole proprietors are not the same as companies employing 50 people. A start-up is different to a company that has been established for 20 years.
Overlaying these very obvious demographic differences are differences in behaviour and attitude. Some small companies are ambitious for growth while others may be happy to generate a living for their owners. Some are well organised in the way they manage their customers, their staff and their cash, while others fly by the seat of their pants. Some are risk averse while others thrive on risk.
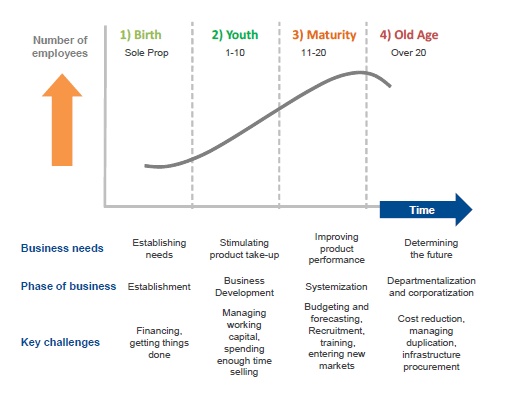
The way small companies are segmented affects the success of a company when aligning its offer to them. A segmentation based on behaviour and needs is likely to be more successful than one based on simple demographics. Towards this end it may be helpful to think about how small businesses are different, not just in demographic terms (or firmographics, as we like to say in business-to-business markets) but in behaviour and needs. One approach could be to use the life cycle and consider how the needs of small businesses change as they grow and mature within the cycle. This could provide interesting opportunities for segmentation.
A framework for thinking about this is presented in Figure 6.

Reaching Small Businesses
In many respects, small companies are easier to reach than corporate organisations. Their small size makes them more accessible. The proprietor holds the cheque-book, very often picks up the phone and is used to making quick decisions. It is seldom necessary to have a purchase order number when selling to a small business.
Most small companies can be easily found in directories. In many countries, they receive a free and automatic entry into the commercial Yellow Pages. They find their way onto databases owned by companies such as Experian or Dun & Bradstreet and from these sources, lists can be acquired. A relatively small budget will buy thousands of names of small companies to a specification of choice.
In Conclusion – Fitting The Glass Slipper
When the going gets tough, governments and companies look to small companies. In rain and shine, small companies pay their energy bills, they buy telecoms, fuel, and insurance and, if they believe there is any chance that their business will grow, they will take on labour. Small businesses are a resilient body that survive in all conditions and adapt quickly to change.
The central argument of this White Paper is that if we want to do business with small companies, we have to understand them. We need to understand how they are different, what drives them, how they behave and most crucially what their needs are. Small companies are the Cinderella of the business world and if we can find a glass slipper that fits them, they make excellent partners.

